How to Create Engaging Infographics for Marketing

Krittitee Tongdang
May 8, 2024
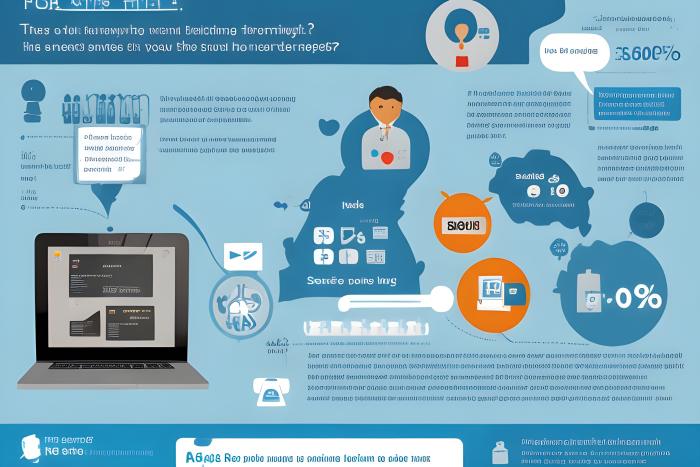
In today’s digital age, most people search for information through search engines like Google or various social media platforms. Long-form text content is often overlooked, as it tends to be less engaging. This is why infographics have become a popular solution, as they simplify complex information into visually appealing, easy-to-digest formats for audiences. Today, infographics play a crucial role in many businesses as a tool to present product or service information, support sales, and provide education. In this article, we’ll explain how to create effective and engaging infographics for marketing purposes.
Infographic

What is an Infographic?

An **infographic** transforms information—whether general knowledge, product details, or service data—into visuals and charts that make the content easier to understand. It helps audiences comprehend complex information through simplified and concise visuals. Typically, infographics are used to communicate complicated data more clearly, often incorporating bar charts or example visuals to aid understanding. Related Article: Create Graphics Easily Without Photoshop

Types of Infographics for Marketing Purposes

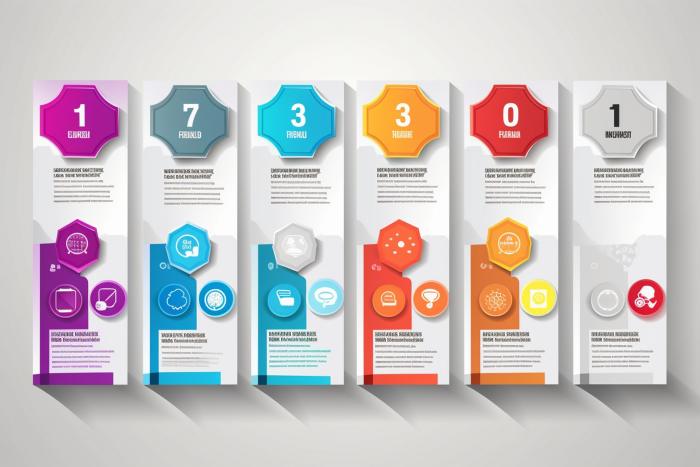
Businesses aiming to present information—whether to introduce products, explain services, or provide how-to guides—often use **infographics**. Understanding different types of infographics will help you choose the right format for your goals and audience:

Statistical Infographics

**Statistical infographics** present data through visual elements like charts and graphs. They help audiences easily grasp comparisons or key points through well-organized visuals, making complex statistics more engaging and digestible.
Infographic

Process Infographics

**Process infographics** are commonly used to demonstrate how products work or how to maintain services. They simplify complicated steps into easy-to-follow visuals, attracting potential customers who are curious about the process or usage.
“Short, visual explanations of processes attract more attention.”
Informational Infographics

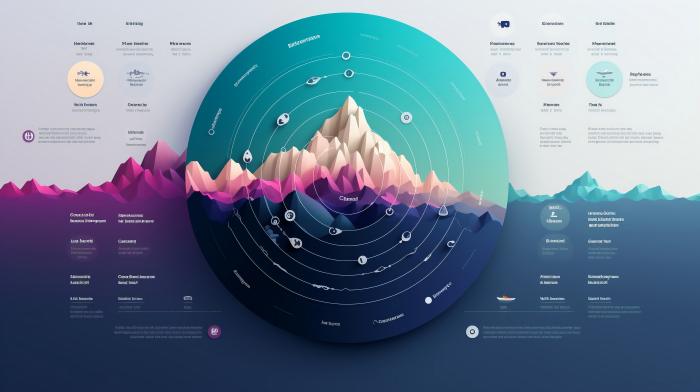
**Informational infographics** are often used in promotional posters to include key contact details or explain how audiences can engage with a brand. Clear visuals combined with concise text help convey this information effectively.
Infographic

Comparison Infographics

**Comparison infographics** break down information to highlight the differences between similar products or services, showcasing features, pros and cons, or side-by-side comparisons. These visuals help audiences make informed decisions quickly and easily.

Map Infographics

**Map infographics** visually present geographical data, such as locations or distribution of specific information across regions. They help audiences understand geographical content more clearly, whether for navigation or demographic insights.

Timeline Infographics

**Timeline infographics** present information chronologically, making it engaging and easy to follow. These are useful for showcasing company history, product development milestones, or significant events to build trust and credibility.
Infographic

Tips for Creating Attractive Infographics

Designing infographics that capture attention at first glance isn’t easy. Graphic designers know this well—creating impactful designs takes time. To help, here are essential tips to craft infographics that are visually appealing and effectively communicate information:

Define Your Objective

Clearly defining the purpose of your infographic is critical to align with audience expectations. Know what message you want to convey and who you’re targeting before you begin creating.
“Identify whether your infographic aims to promote a product, enhance brand awareness, or drive social engagement.”
Related Article: How to Create Engaging Facebook Posts to Boost Sales

Select Relevant Information

Choose data that is relevant and valuable to your target audience. Infographics should distill information into easily understandable and visually appealing formats. Ensure all facts are accurate, concise, and from credible sources.

Design an Engaging Structure

Structure plays a key role. Understand your audience’s preferences to create an organized layout that enhances readability. Break information into sections and present it in a logical flow for better comprehension.

Use Appealing Colors and Visuals

**Color schemes and visual elements** significantly impact viewer engagement. For social media, use vibrant visuals and brand-aligned colors to grab attention. Well-designed infographics with quality visuals are less likely to be ignored.
“Selecting eye-catching colors and aligning them with your brand is crucial. High-quality images enhance the infographic’s appeal and effectiveness.”

Incorporate Graphs and Charts

Graphs and charts enhance clarity, especially for data-heavy content. They help audiences quickly grasp complex details, making your infographic more informative and increasing the likelihood of conversions.
Infographic

Conclusion

For businesses engaged in digital marketing, educational infographics play a pivotal role in attracting target audiences interested in how your products or services benefit them. Creating visually appealing, informative infographics helps boost brand awareness and drive sales. If your business lacks a graphic design team for creating infographics or ad creatives, consider partnering with our digital marketing agency. Our team of marketing, content, and graphic experts can craft compelling designs tailored to your audience’s needs. Explore our comprehensive page management services, Shopee/Lazada store management, and more.

Share: